Assessment of Future Typical Meteorological Year Data Files
Client: NYSERDA
Project Dates: 2020-2021
Project Team: Resource Refocus and the University at Buffalo Department of Architecture
Report Link: 21-01 Assessment of Future Typical Meterological Year Data Files [PDF]
project summary
Weather data has a wide range of applications in the built environment such as the analysis of EEMs, life cycle cost, emissions, embedded carbon, and urban heat islands. For the past 40 years, building simulation efforts have typically relied on TMY or reference year data (Crawley 2019), but recently some applications have been switching to alternate weather files, such as future typical meteorological year (FTMY) and extreme meteorological year (XMY) data.
This study explored the impact of switching from existing TMY datasets (which generally use weather from 2005 and earlier) to recent or future-looking datasets. The study started with a literature review and stakeholder interviews, which revealed an active field of emerging research into weather files.
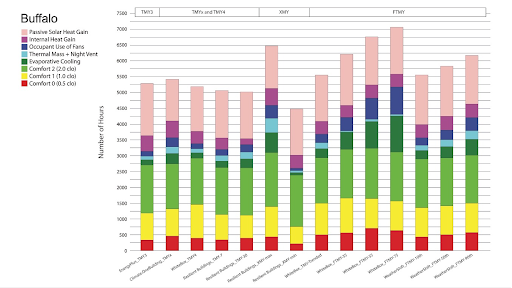
Next, a weather file analysis explored the data variation across weather file types. Buffalo, New York City, and Saranac Lake were selected as the representative cities to explore in depth (based on their climatic range and weather file availability). The analysis compared HDD and CDD, hourly temperatures, and the potential for passive design strategies for envelope dominated buildings. An example in Buffalo is shown below.
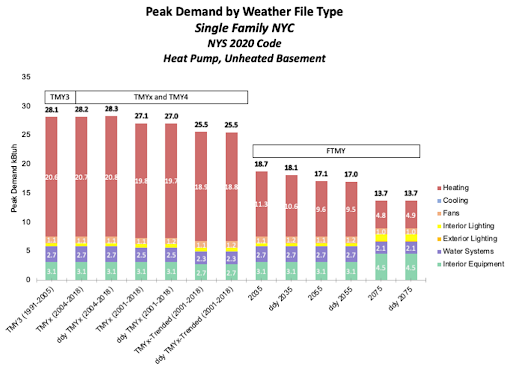
For the modeling exercise, the team focused on envelope-dominated buildings which will be more affected by a change in weather than internal-load dominated buildings. The exercise explored how end use energy use intensity, peak demand, and HVAC run times were affected by weather file type. The results for Buffalo EUI and peak demand were broken down by end use are shown below.
In all three locations, the warmer weather files all result in a higher number of hours for which the passive strategies can achieve comfort (based on the psychrometric chart analysis). However, the distribution of the hours within these totals varies.
For this limited analysis, the overall trend is for decreased heating and increased cooling, and this is more pronounced in Buffalo than in NYC. In general, site EUI and peak demand decrease over time or with increased climate projection percentiles for this single-family heat pump example. But, this occurs with a general shift from heating to cooling needs. If a mixed fuel case were explored -- when the peak demand is likely to be driven by air conditioning in the summer months -- one would expect to see an increase in peak demand over time.
Key Findings
There is a need for better data sharing to have clear methodology documentation, validate data, and to better compare analyses for projection and policy.
More research is needed to convert dynamic downscaled GCMs into weather data suitable for building energy simulation.
There is a need to standardize protocols for future weather files, for the methodologies used to create them and the protocols for their use.
The results of our limited analysis show that peak demand is especially sensitive to the weather file selection.
Challenges
Switching weather data formats is a collective action problem that affects multiple stakeholders.
There is a lack of vetted data available for future-looking weather files in formats that can be used in building simulation tools.
Morphed data is available, but there are concerns about psychometric accuracy in general.
Dynamically downscaled projections are considered to be more robust than morphed data, but are not generally available in building simulation-ready TMY-type formats.
Historical weather files are insufficient for properly modeling future scenarios.
Crawley, D., et al., 2019. “Should We Be Using Just ‘Typical’ Weather Data in Building Performance Simulation?” Building Simulation 2019 Proceedings.


